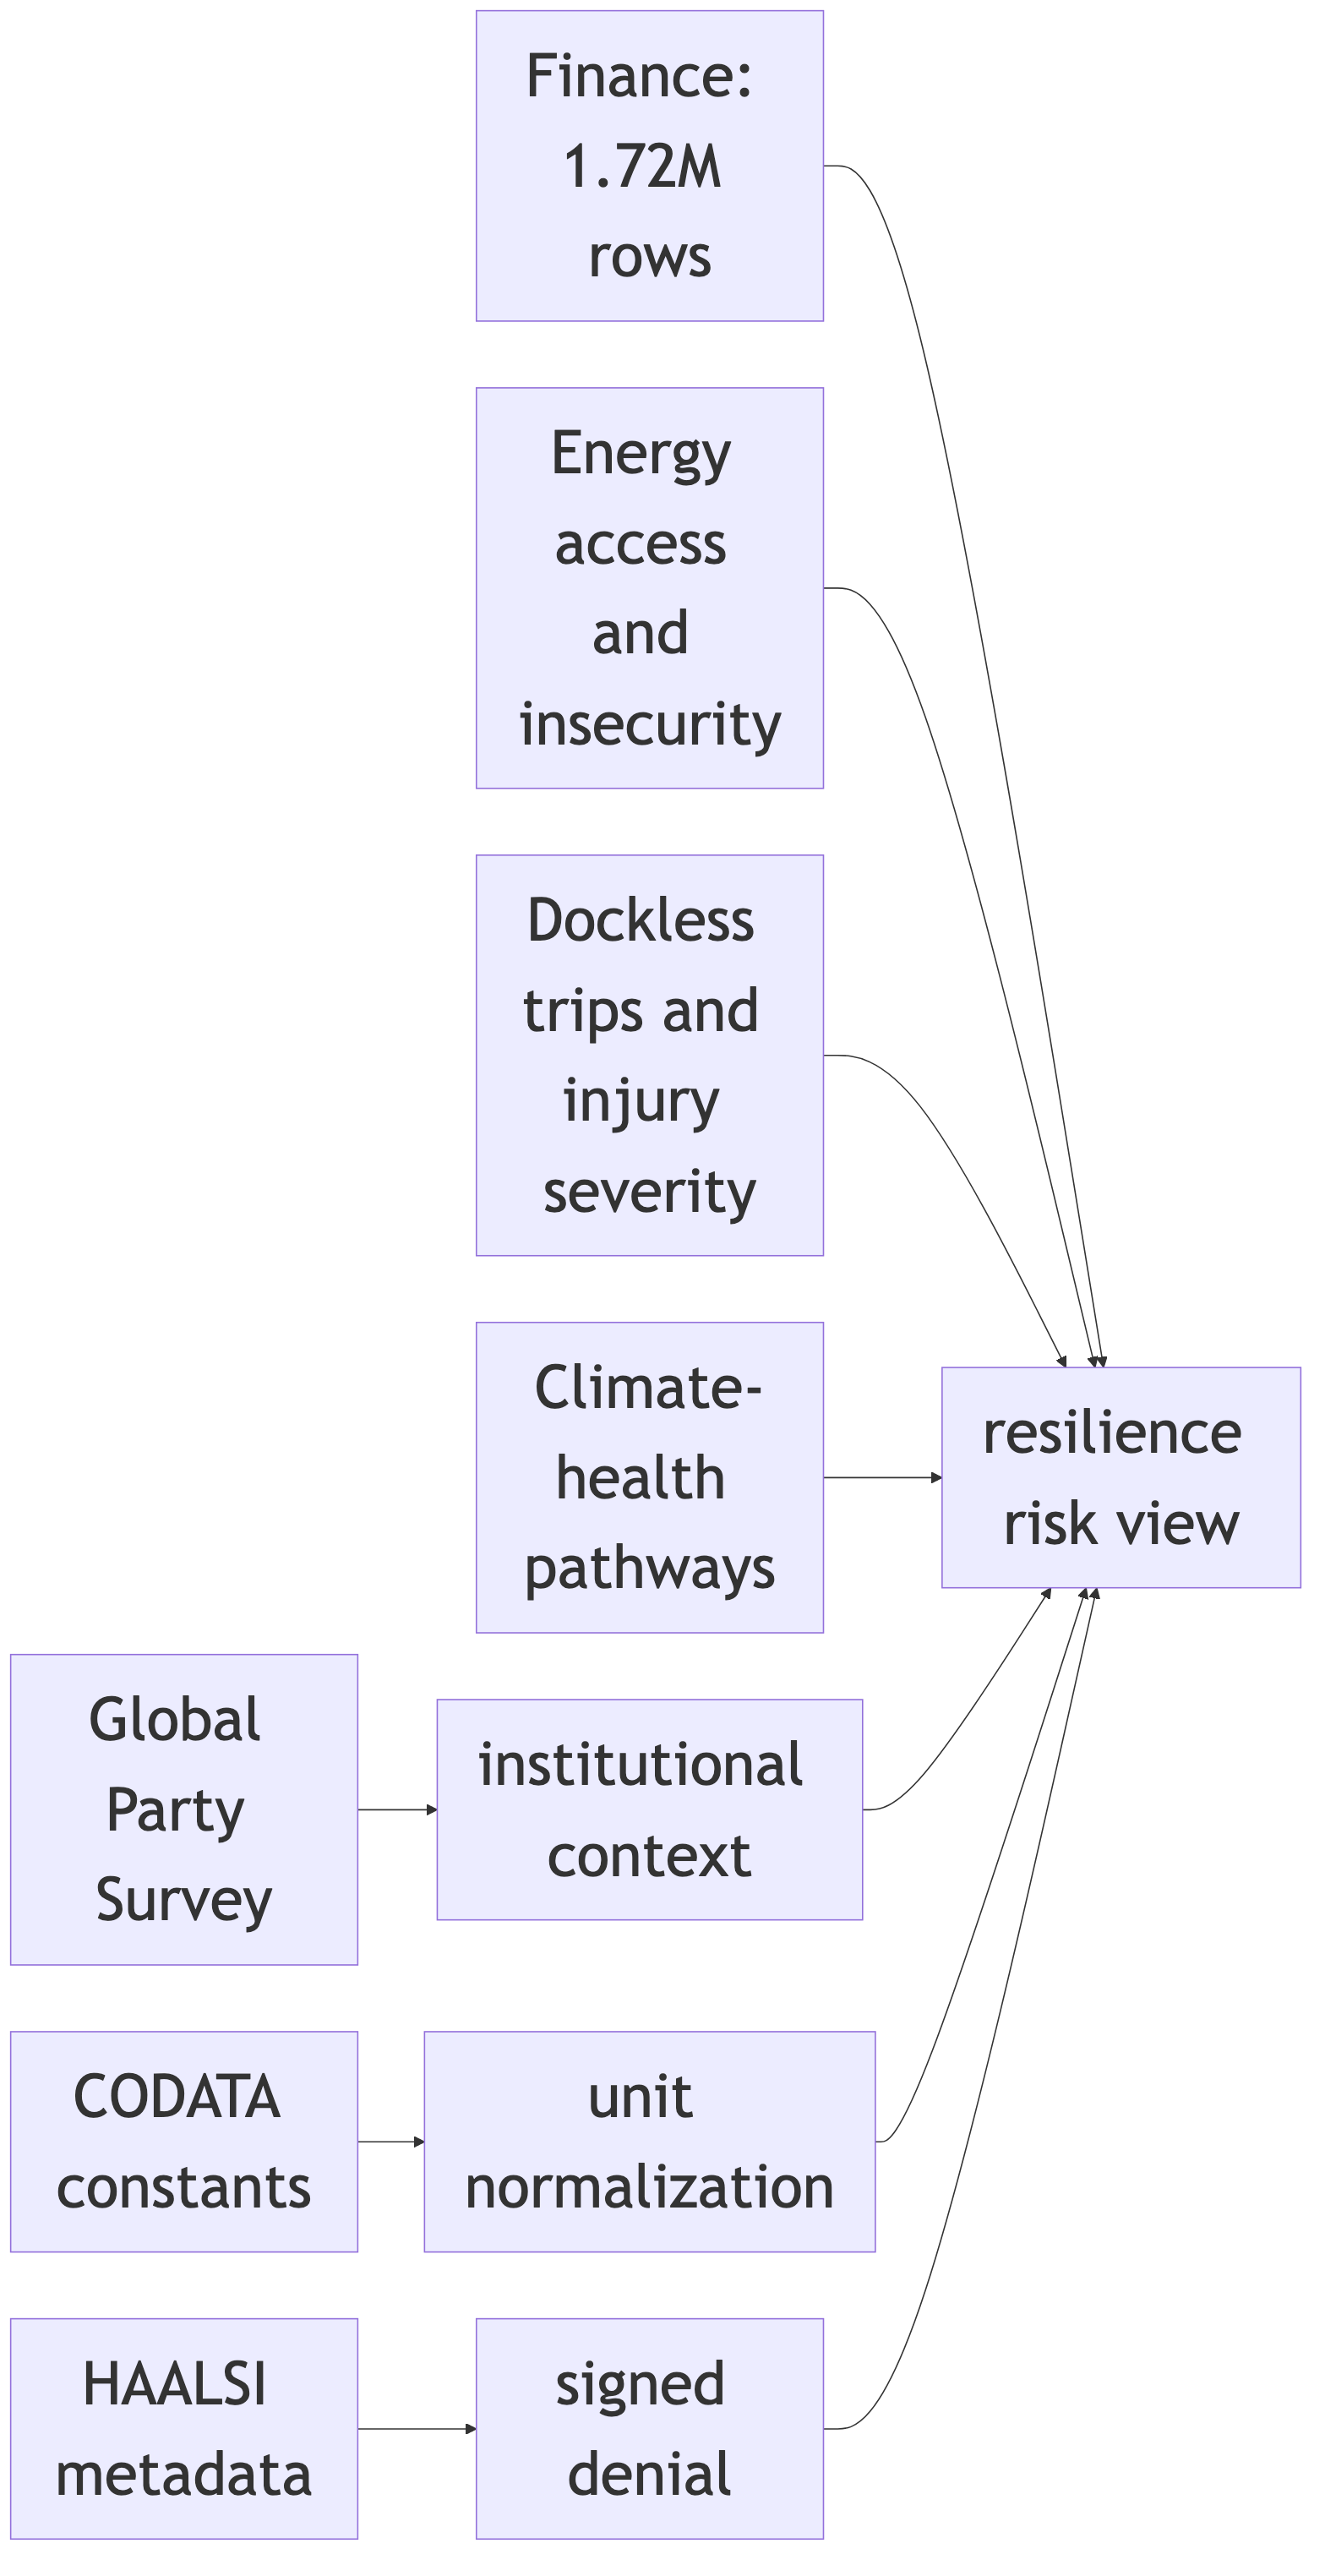
The default corpus is intentionally broad. It is not a toy table. It mixes finance, energy, transportation, health, climate, social science, geospatial assets, and reference data so the navigator has to cross real semantic boundaries.
The first principle is that an AI Navigator should be demonstrated on messy, multi-domain data, not a polished single-table example. The point is not to show that a model can summarize a CSV. The point is to show that governed AI can move across domains while keeping each dataset’s shape, rights, lineage, and meaning visible.
The corpus is also a computational argument. A Big AI demonstration might stuff documents and table samples into a prompt. Querygraph instead turns the corpus into a lakehouse, sidecars, graph nodes, policies, and lineage. Once that work is done, later questions reuse the structure. The system pays the metadata cost once, then benefits from focused retrieval many times.
| Dataset | Category | Persistent ID or source | Typed tables | Rows | Why it matters |
|---|---|---|---|---|---|
| Government Finance Database | finance | doi:10.7910/DVN/LMS8NT |
6 | 1,724,447 | Fiscal capacity, county/municipal/district budgeting, and public-sector constraints. |
| Roadway vulnerability LiDAR DTM | geospatial | doi:10.7910/DVN/1VT6FZ |
0 | 0 | Non-tabular assets and geospatial metadata; proves the catalog can track assets that are not immediately typed tables. |
| ACCESS 2018 energy survey | energy | doi:10.7910/DVN/AHFINM |
3 | 35,779 | Household access to clean cooking energy and electricity. |
| Dockless transportation study | transportation | doi:10.7910/DVN/B2LJSB |
7 | 479,853 | Urban form, trip hotspots, mode shift, and mobility disruption. |
| HAALSI Baseline Survey | health | doi:10.7910/DVN/F5YHML |
0 | 0 | Restricted or inaccessible raw data; demonstrates metadata-only access and signed denial. |
| Global Party Survey, 2019 | social science | doi:10.7910/DVN/WMGTNS |
5 | 6,033 | Institutional and political context as a social-science signal. |
| Connecticut pedestrian injury severity | transportation | doi:10.7910/DVN/TXIKF9 |
1 | 14,645 | Injury severity, land use, transit stops, roadway, and demographic factors. |
| Energy insecurity during COVID-19 | energy | doi:10.7910/DVN/OMJWNB |
3 | 37,907 | Sociodemographic disparities in household energy insecurity. |
| Climate and health pathways | climate health | doi:10.7910/DVN/DHDNIC |
2 | 522 | Climate-linked mortality and pathway data. |
| CODATA/NIST 2022 constants | reference | NIST ASCII table | 1 | 355 | Trusted reference units and constants for normalization. |
The loaded corpus verifies to 28 typed tables and 2,299,541 typed rows. The row count is not the point by itself. The point is heterogeneity: tabular files, XLSX conversion, CODATA normalization, non-tabular assets, and restricted data all travel through one governed catalog.