Here and index two people, and are their nonzero score rows from the same model and coverage window. The person index is distinct from a background row such as . Cosine similarity, written , is their dot product divided by the product of their lengths:
It compares direction rather than length and is undefined if either row is zero. A value near 1 means similarly directed rows, 0 means perpendicular rows, and -1 means opposite directions in the specified centered representation. Negative similarity is not evidence of competition, disagreement, or hostility.
Anthropology’s neighbor view uses complete retained people-score rows within the same model and window. Do not mix a recent profile from one model with an all-history profile from another and call their raw dot product a meaningful similarity. Even matching dimensions are insufficient: the coordinates must share their meanings.
Consider three synthetic two-coordinate score rows: a query and candidates and . Coordinate distance means the length of the difference row. From to the difference is and the distance is 9. From to it is and the distance is 1. Thus coordinate distance prefers .
Cosine asks another question. The dot product of and is 10, their lengths are 1 and 10, and the cosine is . The dot product of and is 1, their lengths are 1 and , and the cosine is , approximately 0.7071. Directional similarity prefers . No contradiction exists: lies farther out along exactly the same direction.
If both rows are normalized, squared coordinate distance becomes twice one minus cosine. To check this, expand the squared difference into the two squared lengths minus twice the dot product. Each squared length is then one. For and normalized , this gives , approximately 0.5858. This equivalence requires unit rows in the same geometry; the original people-score rows are not generally unit rows.
A single selected coordinate can be identical while all the other coordinates differ. Ranking by one axis therefore cannot replace a full-row neighbor calculation. Centering also changes the origin from which direction is measured, so a cosine of uncentered profiles answers a different question from a cosine of their centered people scores.
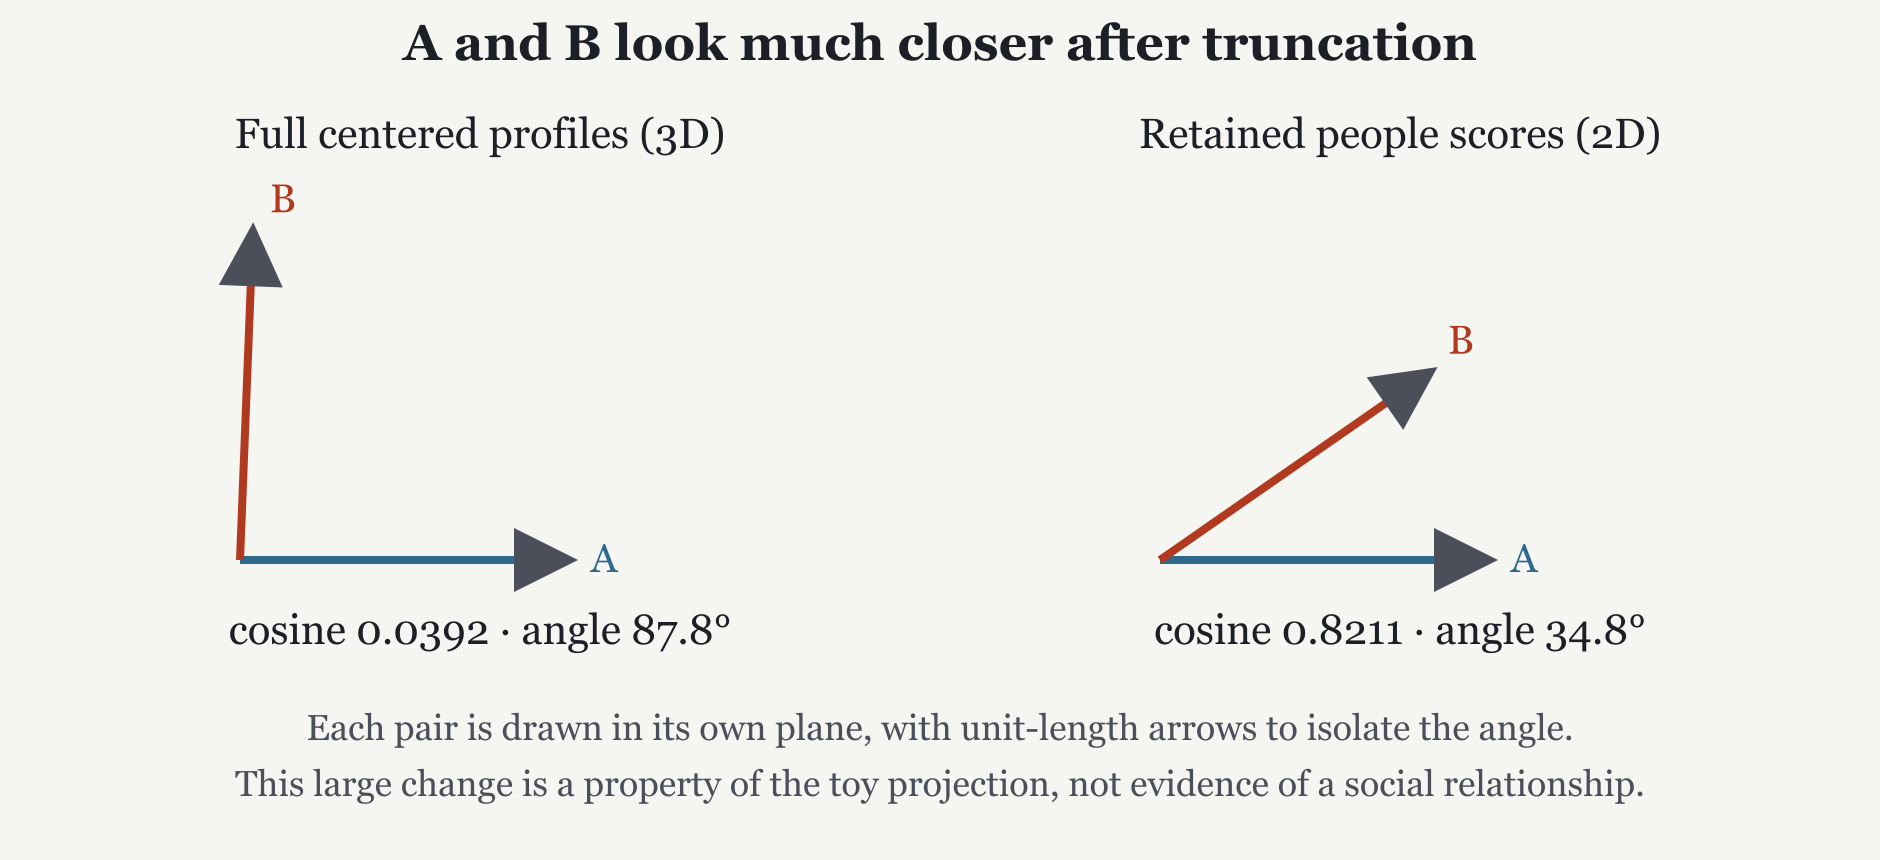
The toy example makes the danger visible. A and B have a cosine of only 0.0392 between their full centered three-coordinate profiles. Their cosine becomes 0.8211 after projection into the two retained people directions.
No arithmetic error occurred. The discarded direction contained much of their difference. The retained plane makes them look more alike. Keeping 81.14% of the population’s total variance did not preserve every pairwise angle.
The same check is useful in the real model. In the frozen Hacker News model, LeCun and Bengio have a retained-space cosine of 0.9587 and a full centered news-space cosine of 0.9118. Ellison and Siebel have 0.7198 and 0.5800 respectively, with 416 and 11 candidate articles. These values describe this corpus and representation; the much smaller support for one member deserves attention.
An appealing analogy can also fail. Zuckerberg and Gates have retained-space cosine 0.0782 in Hacker News and -0.1137 in the separate general-news model. Being prominent technology founders does not require the archives to cover them in the same way. A research system should let the evidence correct the analogy.
Two profiles can be close because the same articles mention both people, because different articles discuss similar subjects, or because the archive repeatedly frames them in a similar way. A cosine alone cannot distinguish these explanations. One useful sensitivity analysis would remove their shared articles and recompute the comparison. That experiment was proposed in the paper; it was not part of the published evaluation.
For a nonzero centered row , retained energy is the fraction of its squared length preserved by projection, . Support counts, full-space baselines, retained energy, dates, and example articles help a reader interpret a score. Calibration means agreement between predicted probabilities and observed frequencies. These aids do not turn a neighbor score into a calibrated probability of collaboration. A documented relationship still requires its own source. The named examples here demonstrate navigation, not a statistically representative assessment of retrieval quality.
Check 7. Does retaining 81.14% of total variance guarantee that every neighbor cosine changes by less than 18.86 percentage points? Use A and B to test the claim.